
| Managing production is at the very core of what a supervisor does. The foreman manages at the crew level. The superintendent manages at the | ||||
| job level, but supervisors at all levels have the responsibility to ensure that the project is completed on time, on schedule, safely, and at a high level of quality. Hence, they have the responsibility to manage the production process. Managing production is of personal importance to a supervisor. Often, the reason craft workers become foremen is because they think that they can lead the crew and accomplish the work more effectively than other foremen they have known or worked for. Of course, becoming a foreman might not be by the initiative of the craft worker, but rather by the determination of someone higher up in management. Craft workers are often selected to be a supervisor because they demonstrate a number of traits and skills that lead to effective production, which is what management wants. Thus, whether it is their own decision or that of a manager above them, the decision to have a craft worker become a supervisor is based primarily upon the ability to produce. The primary metric for evaluating supervisory performance is how well the supervisors manage their part of the project. Supervisors are evaluated by the managers above them, based on such criteria as how well their crew accomplishes assigned work, and how effectively work assignments move the project toward successful completion. Supervisors are also evaluated based upon how efficiently (economically) work is completed, what the quality of the work is when it is completed (eliminating rework), and how safely the work was done. All of these are measurements of production. |
||||
| 279 | ||||
| 280 TECHNICAL SKILLS | ||||
| UNDERSTANDING PRODUCTION AND PRODUCTIVITY Production can be defined as the process of producing a product. In construction, production is accomplished by bringing together materials, tools, and workers at a specific location so that the workers can use the tools to install the materials and produce their component of a complex project. Productivity measures the efficiency of production. It expresses the classic relationship that exists between what is used to produce the product (inputs) and how much product is produced (outputs). This relationship can be shown as: Productivity = Outputs/Inputs Higher productivity means more is produced with less input. Lower productivity means that less is produced with the same input, or more input is required to produce the same product. In construction, productivity is typically measured in terms of the number of units produced per hour of work. The hours might be in terms of individual worker hours, crew hours, or machine hours. Examples include: ■ Feet of 2-inch conduit installed by an electrician in an hour ■ Bricks laid by a masonry crew in an hour ■ Cubic yards of soil moved by a scraper in an hour Money may be used as the measurement of investment instead of time. However, measuring money is not as useful as measuring time because the amount of money expended per unit of output varies with a number of different factors. Labor cost depends on the labor rate (dollars per hour paid to the craft worker), which in turn varies due to a number of factors, such as where the job is located, when the job occurs, and how the labor rates were negotiated. Hours tend not to change nearly as much from one location to another and from one time frame to another. |
||||
| Example | ||||
|
To illustrate the relative stability of time as a measurement of investment in a project as opposed to money, an electrician in Phoenix can be expected to install about the same amount of conduit in an hour as a similarly skilled electrician in Denver. However, the labor wage rate in Denver will be different from that in Phoenix, so the cost of the work will differ from one city to the other. Also, the same electrician working in Phoenix would have installed about the same amount of conduit in 2000 as she can be expected to install in Phoenix in 2010, but her wage can be expected to be considerably more in 2010, resulting in a higher cost to complete the same work. |
||||
|
Another impediment to using money as the basis of measuring production is that management often believes that production units expressed in terms of money are proprietary and are a closely held secret of the company. Management tends to |
||||
| MANAGING PRODUCTION 281 | ||||
|
be far less sensitive about how much production a craft worker or crew can achieve in an hour than how many labor dollars per installed unit it costs the company to accomplish work. Supervisors, too, generally prefer measuring production in terms of hours rather than in terms of money. Hours are useful because they equate to schedule, and time is always important in construction. Additionally, from the time supervisors began as apprentices, they experienced and observed work accomplishment in terms of time, not money. Thus, basing evaluations of production on time is more natural to the supervisor, who can relate the time required to complete a certain amount of work to personal experience. For all of these reasons, production and productivity are evaluated primarily in terms of time. Production measurements can easily be converted to monetary terms based upon local conditions, if required. |
||||
| Example | ||||
|
To illustrate the conversion of production rates between time and money, if the electrician installed 1000 feet of 2-inch conduit in Phoenix in 2000, at a production rate of 10 feet per hour, the rate in terms of money might have been $2.50 per foot. In 2010, the production rate would be the same, but the money based rate would be $3.00 per foot because of an increase in the wage rate of the craftsman. In Denver in 2010, the money based rate would be $2.75 per foot even though the production rate would still be 10 feet per hour, for the same reason. |
||||
| IMPROVING PRODUCTION Production can be improved at many levels. The classic approach to improving production in construction starts by identifying inefficient activities through cost reports, as discussed in Chapter 13, through schedule updates, or through weekly coordination meetings, as discussed in Chapter 14. With more sophisticated companies, a problem-solving process, like the one described in Chapter 8, is then followed to determine the root cause, to identify and implement the best solution, and to evaluate the results after implementation. All of the production improvement measures noted above are reactive measures, since they are not undertaken until a problem has been identified. It should be noted that it is far preferable to take proactive measures to improve production. These proactive improvement measures can be undertaken at several levels. The first level to consider is improving ongoing production at the activity level. Then, stepping back to the beginning of an activity, the planning process can be used to develop the design of a more productive way to execute the activity even before that activity has begun. Finally, stepping back still farther, consideration will be given to how execution of the overall construction process can be improved. |
||||
| 282 TECHNICAL SKILLS | ||
| IMPROVING PRODUCTION IN AN ONGOING ACTIVITY In manufacturing, where activity execution tends to be highly repetitive, every effort is made to design the manufacturing process to operate as efficiently as possible. After production begins, highly repetitive manufacturing processes are studied intensively in order to identify potential productivity improvements. Manufacturing engineers understand that even those production processes that are functioning very well can be improved, and with further iterations these improved processes can be further improved. On the other hand, constructors tend not to look for process improvements, especially if a project is meeting its schedule and cost goals. Construction activities tend, by nature, to be inefficient. This is because of both the harsh environment within which construction is executed and the fact that construction activities are not highly repetitive like manufacturing activities. Therefore, it is accepted in the industry that construction activities will not be very efficient; and as a result, estimates of time and cost are based upon inefficient activities. In construction, activities tend to be planned according to the way similar activities were done in the past. And once activities have been planned, little consideration is given to improving the process unless cost reports or schedule updates indicate that there may be a problem. Process improvement is based on repetition. However, even though contractors repeat the same types of activities from job to job, the specific conditions of the job vary so the processes are not repetitive. Even a repetitive activity on a specific job does not repeat exactly the same way. In the relatively controlled environment after a building project has been closed in, the location changes and crews change so that repetitive type activities are not truly repetitive. For outside activities, not only do the location and crews change, but weather and working conditions change as well. Sophisticated contractors try to capture lessons learned from past projects to improve planning and execution of activities on current and future projects, and to develop a record of best practices. However, few engage in active production improvement studies on an ongoing project, especially if the project is going well as measured by meeting or exceeding project objectives in terms of time, cost, quality, and safety. In construction, production improvements are generally not pursued unless a problem is identified. However, as constructors can learn from the manufacturing industry, even an activity that has not been identified as a problem activity because it is behind schedule or over budget can generally be improved. A number of tools are available to help identify where opportunities lie to improve production in repetitive activities. Three such tools will be considered. Production Analysis Tools A process chart (see Figure 15.1) shows the steps in an activity and the duration of each step. |
||
| MANAGING PRODUCTION 283 | ||||||||||||||||||||||||||||||||||||||||||
|
||||||||||||||||||||||||||||||||||||||||||
| Process Chart | ||||||||||||||||||||||||||||||||||||||||||
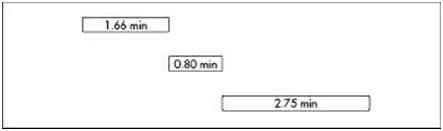
| Figure 15.1 Process Chart The process chart helps to define the steps that make up an activity and to quantify how long each step takes. After observing an activity and determining the basic steps that compose the activity, the time required for completion of each step is determined by measurement. Since, in construction, the time required to execute a step in an activity can vary significantly from cycle to cycle because of variability in the way workers perform, the accuracy of the times put into the chart can be improved significantly if time is measured for several cycles and averaged. A crew balance chart (see Figure 15.2) shows the activity in terms of the work performed by each crew member in carrying out each of the steps. Again, the data for this chart are gathered by direct observation and measurement. The crew balance chart shows clearly which crew members are contributing to the activity at any given time and, hence, how much of the time each crew mem- |
||||||||||||||||||||||||||||||||||||||||||
|
||||||||||||||||||||||||||||||||||||||||||
| Crew Balance Chart | ||||||||||||||||||||||||||||||||||||||||||
| Figure 15.2 Crew Balance Chart | ||||||||||||||||||||||||||||||||||||||||||
| 284 TECHNICAL SKILLS | ||||
 |
||||
| Figure 15.3 Flow Chart | ||||
|
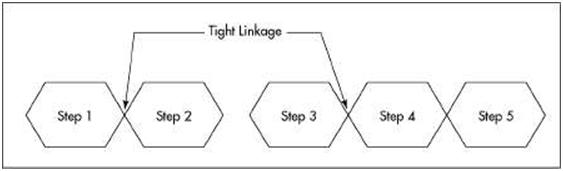
ber is working. When using a crew balance chart, it is important to explain to workers that the activity on which they are working is being studied in order to improve its execution. It must be made clear to the workers that there is no intent to collect data on individuals other than to analyze activity production and that activity production is the focus of the study, not worker performance. The third production analysis tool is the flow chart (see Figure 15.3), which represents how the steps relate to each other. Construction is achieved by execution of a series of interrelated or linked steps. Many of the steps are tightly linked, meaning that the predecessor activity must be completed prior to starting (or completing) the following step, which is called the successor activity. |
||||
| Example | ||||
|
To illustrate the predecessor-successor relationship, when considering a sequence of activities in the construction of a concrete wall, placing forms is the predecessor activity to placing concrete and stripping forms is the successor activity. |
||||
|
The flow chart helps supervisors understand how one step is influenced by other steps, or in terms of activities, how one activity is influenced by other activities that precede it. In considering the flow chart, it quickly becomes clear that if one step is tightly linked to a predecessor, any disturbance to the predecessor activity will have an impact on the successor activity, and possibly on a number of successor activities. The disturbance to the predecessor might come from within the predecessor step, or it could come down the chain of tightly linked predecessors from some step well before the current step. On the other hand, if the tight linkage can be relaxed at some point between the disturbed predecessor and the current step, then the disturbance in that |
||||
| MANAGING PRODUCTION 285 | |||||||
| predecessor will have diminished impact on the current step. This holds true until the flexibility in the linkage of steps is used up. | |||||||
| An example will demonstrate the use of these three tools. Here is a case study of cutting electrical cables for installation into cable trays in an industrial plant. This illustrative example is based upon a real study of an activity in a project that was considered at the time to be successful, and the cable cutting activity was considered to be going well. The cable-cutting process involved writing labels, attaching a label to one end of the cable, pulling the cable off of a large reel to the required length, reeling up the measured cable and cutting it from the large reel, and finally attaching a label to the newly cut end. Figure 15.4 shows the flow chart for this activity. |
|||||||
| Make Labels | Apply Label 1 | Pull | Reel & Cut | Apply Label 2 | |||
| Figure 15.4 Cable-Cutting Flow Chart There are five steps in this activity, and each is completed before the next is begun. Time measurements for the activity taken through four cycles indicated that the entire activity averaged 5.25 minutes. The resulting process chart is shown in Figure 15.5. |
|||||||
| Time in Minutes | 0 23456 | ||||||
|
Label Pull Reel & Cut |
 |
||||||
| Figure 15.5 Cable-Cutting Process Chart This activity was initially carried out by a crew of three electricians. The work accomplished by each worker is illustrated in the crew balance chart shown in Figure 15.6. |
|||||||
| 286 TECHNICAL SKILLS | |||||||||||||||||||||||||||||||||
|
|||||||||||||||||||||||||||||||||
| Figure 15.6 Cable-Cutting Crew Balance Chart The crew balance chart clearly shows a significant amount of unproductive time on the part of the crew members. The conclusion can be made from this chart that one of the crew members is not essential to this operation and that the operation can be performed by two electricians instead of three. Several options are available to improve the production. The supervisor could have two electricians pulling, reeling, and cutting instead of just the one. Or, he could reassign one of the electricians to another activity. Or, he could lay off one of the electricians. On a job the size of this industrial plant, it would probably be easy for the supervisor to reassign one of the electricians. After the reassignment, the two-person crew proceeds with the activity. Again by observing and measuring time, a revised crew balance chart is drawn (see Figure 15.7). |
|||||||||||||||||||||||||||||||||
| Time in Minutes | 0123456789 Label 1 Pull Reel & Cut Label 2 | ||||||||||||||||||||||||||||||||
| Worker 1 | Make labels .67 .67 Apply labels .17 | .17 | |||||||||||||||||||||||||||||||
| Worker 2 | Pull, Reel & Cut | 3.50 | |||||||||||||||||||||||||||||||
| Figure 15.7 Revised Cable-Cutting Crew Balance Chart It should be noted at this point that the initial investment of worker time per cycle, based upon a crew of three electricians working for 5.25 minutes per cycle, averaged 15.75 worker minutes. In the improved process, with two electricians working for 4.50 minutes, the improved investment of |
|||||||||||||||||||||||||||||||||
| MANAGING PRODUCTION 287 | |||||||||||||||||||||||||
| worker time was 9.00 minutes, showing a significant savings over the initial process. This large industrial project required about 2.5 million feet of cable with an average length of 100 feet. If the burdened labor rate were $40.00 per hour, the savings of 6.75 worker minutes per cable would result in saving $4.50 per cable or $112,500 for the 25,000 cables. However, this was not the end of the improvement exercise. The revised cable-cutting crew balance chart (Figure 15.7) indicates that a significant amount of time was still being wasted by the fact that the electrician who was performing the labeling was waiting for the cable to be pulled, reeled, and cut. It was determined that there was no reason why a single electrician could not make and apply the labels, as well as pulling, reeling, and cutting cable. A third opportunity for improvement was also identified. The step of making the labels, was analyzed, and it was determined that the labels did not have to be prepared at the time they were applied to the cable ends. Instead, they could be prepared beforehand offsite and provided in a batch to the electrician. The cables were defined by a tabular schedule on the drawings indicating the start point and end point of each cable. This is precisely the information required to make a label. So a set of labels was prepared by a clerical person in the office, using the information in the cable schedule, and then the premade labels were provided to the electrician in the field. The resulting activity is represented by both a crew balance chart and a flow chart in Figure 15.8. |
|||||||||||||||||||||||||
| Worker 1 |
|
||||||||||||||||||||||||
| Worker 2 | |||||||||||||||||||||||||
| Figure 15.8 Final Cable-Cutting Crew Balance Chart and Flow Chart | |||||||||||||||||||||||||
| 288 TECHNICAL SKILLS The final improvements resulted in a single electrician working in the field for an average of 3.83 minutes per cycle, plus some clerical time in the office to make the labels. It was determined that the label making could be done independently of the field activity and with less costly labor. The resulting savings over the previous improvement were significant, and the overall savings resulting from the activity analysis were very significant. Howell, G., Laufer, A., and Ballard, G. (1993). “Interaction between Subcycles: One Key to Improved Methods.” Journal of Construction Engineering and Management, ASCE, New York, NY, 119 (4) 714–28. |
||
| Two Basic Production Improvement Principles The illustration described in the paragraphs above demonstrates how to use the three tools introduced earlier, in order to improve production. It also provides some basic principles that can be applied in looking for improvements in ongoing activities. First, supervisors will do well to look for and eliminate slack time, which is time when workers are not productively engaged in work. We must remember, and must reassure the workers, that the intent is not to place blame, but rather to identify where inefficiency lies so that the inefficiency can be eliminated. Second, supervisors can look for opportunities to relax or remove the link between tightly linked steps. In the case study, the step of making labels could be separated from the field operation by inserting a buffer of prewritten labels between two tightly linked steps, thus separating one from the other. A buffer is something inserted in a construction operation in order to relax the interaction between, or to disconnect, related activities. Buffers fall into a variety of categories, including: ■ Space ■ Time ■ Labor ■ Tools and/or construction equipment ■ Material and or installed equipment In the example, buffers in the form of time and space were inserted between the steps of making and applying the labels. A material buffer was also used in the form of the premade labels sent to the job well before the cables were cut. |
||
| DESIGNING A MORE EFFICIENT TASK Instead of waiting until a repetitive activity is in process to analyze it and improve it, supervisors should think in terms of planning the activity in such a way that it will be |
||
| MANAGING PRODUCTION 289 | ||
| more efficient when it is performed. This can be an extremely effective technique. Such an analysis may involve a First Run Study, which can be defined as an explicit, detailed plan for an activity prior to starting work on that activity. First run studies consider many aspects of the activity, such as: ■ Safety ■ Operation ■ Sequencing and relationship to other activities ■ Crew balance ■ Tools and construction equipment ■ Anything else that may affect this activity or related activities First Run Study Setup To begin the First Run Study, an appropriate activity is selected. Several characteristics are considered in selecting an appropriate activity. An activity should be selected that is about to begin. The activity might be at the beginning of the project or when the project is about to enter into a new phase. An appropriate activity will be repetitive, with a relatively short cycle of repetition. That is, cycle duration should be in terms of minutes, rather than hours or days. The activity will involve a limited number of workers since, if possible, all workers should be involved in the study process. When learning the First Run Study process, additional characteristics should be considered. The activity should be a standard activity and one familiar to the team that will be performing the First Run Study. It should be on a project that is considered to be successful, and it should not be a highly complex activity. After the First Run Study technique is mastered, more complex activities can be studied and projects that are in trouble can be considered. However, studying complex activities or troubled projects before mastering the First Run Study process is not a good idea, because it may be unclear whether the First Run Study or other events have actually resulted in the observed improvements, or the lack thereof. It is also important to start with an attitude that this will be a learning process. Early studies may not be very successful, but early on, it is more important to learn the process than to have a resounding success in production improvement. It is interesting to note that, in many cases, it has been found that novices are more successful at first run studies than highly experienced supervisors. More experienced supervisors tend to be constrained by past experience and are often not able to think creatively. The tendency for these experienced supervisors is to fall back to solutions that have resulted in success in the past, rather than seeking new and creative solutions. Less experienced supervisors often are more willing to ask questions and seek nontraditional approaches. After the activity for the First Run Study has been selected, a study team is brought together. The First Run Study team is comprised of a broad cross-section |
||
| 290 TECHNICAL SKILLS of those participating in the activity, including the foreman, craft workers, and perhaps suppliers and workers from related activities. To get a different perspective, a participant from the office might be included, such as the project manager or the estimator who estimated the project. Although they often are not involved in day-to-day activities on the job, both estimators and project managers can frequently come up with very creative ideas. First Run Study Plan To start the study, a process chart is developed. This helps identify critical steps in the activity and the relationships between the steps. A brainstorming process can be used to encourage creativity and to involve all participants in the process. Particular care should be used to ensure that all critical steps in the activity are identified and clearly defined. Once the activity process chart is completed, it should be reviewed and then checked against several criteria. The first check should be for safety. Where does the risk lie, in the performance of this activity? Are there hazards to be accounted for? What preventative measures need to be used to minimize risks and hazards? Next, the supervisor should consider where the activity might go wrong. How might the quality of the work be impaired? What could cause delays in the various steps? What mitigations can be used to lower the risk of something going wrong? In the event one of the identified potential problems actually happens, what steps can be taken immediately to deal with the problem? A key part of the First Run Study is to observe early cycles to learn what is working as planned, what is not working, and where a new approach might be incorporated into later cycles. During the initial planning stage, the supervisor should determine what will be observed, what data should be collected, and what key factors indicate whether the activity is improving or not. It is important to identify what is to be observed and what data are to be collected prior to the first work cycle. First Run Study Execution Next, the supervisor should take the workers, and the materials and equipment, to the work site and execute one cycle of the plan. The observer should watch the specific steps identified in the plan and collect the specified data. The observer will most likely see problems with the plan, but this is normal. The cycle should not be stopped, and no corrections should be made during the cycle, unless they relate to an urgent safety situation. In addition to collecting specific data, the observer should keep in mind the following questions: ■ Have the planned steps been executed? If not, why not? ■ Have any unanticipated interactions between steps or with other work going on been identified? |
||
| MANAGING PRODUCTION 291 | ||
| ■ Were there any problems with the quality and quantity of work completed? ■ Were any safety issues detected? ■ Were essential resources available and accessible when required? First Run Study Analysis and Redesign After the cycle has been completed, the team reconvenes to evaluate the cycle. The observer reports to the team on all observations. The workers add observations of their own. Each observation is discussed. A revised plan is developed, and the next cycle of work is initiated. This process of planning, execution and observation, analysis and redesign is continued through several cycles until the team agrees that the obvious improvements have been identified and incorporated. Work then proceeds in a steady state. Two Operational Changes Taking a broader look at the process, two changes from the traditional approach become apparent. First, planning becomes more important than doing. Doing the work should be a result of the planning process. When given a new task, the tendency of the workers is to immediately begin working. The inclination is to start as quickly as possible, so as to be able to finish as soon as possible. When doing First Run Studies, it becomes apparent that, with proper planning, the activity can be started later but can be finished earlier and more efficiently. While this may be counterintuitive, it has been shown to be true time and time again. Second, much of what supervisors do is to answer questions. Answering questions is reactive management. With a First Run Study, the focus shifts from the supervisor providing answers, to the supervisor asking questions. Supervisors move from a reactive to a proactive management position. Engineering students learn very early in their academic preparation that formulating the problem (i.e., asking the right questions) is of fundamental importance to getting to a useful solution. Without asking the right questions, it may be impossible to get to a solution. Even if a solution is attained, if it is the right solution to the wrong question, it will lead down the wrong path. If it is a wrong solution resulting from an improperly formulated question, it will again lead down the wrong path, causing significant inefficiencies. On the other hand, asking the right questions on a proactive basis will lead to effective solutions. |
||
| IMPROVING CONSTRUCTION OPERATIONS We have considered how to study an ongoing activity in order to improve production. We then moved on to explore pre-planning as a means to design a more efficient activity. We will now look at design of the construction process to improve overall operation of the project by introducing concepts of Lean Construction. |
||
| 292 TECHNICAL SKILLS | ||
|
To be able to understand and analyze the complex operations on a construction project, it is important to develop a model that demonstrates how construction operations work. This will become a production model for construction. The simpler the model, the more effective it will be, as long as it provides an accurate representation of how construction works. Many different types of models are used to represent different aspects of construction, so the concept of a model should be quite familiar to supervisors. The schedule is a time-based model of construction that shows when activities happen, how long they take, and how they relate to other activities. The budget is a cost-based model that reflects construction activities in terms of investment of resources, predominantly money. Drawings are a graphical model of the project and specifications are a verbal model of the project. Without drawings and specifications, it would be impossible to visualize the project, share information about it, and build it. The production model of construction should correctly represent the processes of construction. It is important to think of construction as a series of processes, because processes can be learned, repeated, controlled, analyzed, and improved. A primary reason to develop the production model for construction is to be able to effectively control construction operations through better understanding. The Breakdown of Traditional Controls In earlier chapters, traditional tools that are utilized to control construction operations have been discussed, including scheduling and cost control systems to control time and budget. However, experienced supervisors know that, even though these are among the best tools traditionally available to move the project in the desired direction, they are frequently not very effective. This truism is illustrated by the fact that although supervisors talk about driving the project with a schedule, the fact is that the project drives the schedule. The result is that schedules need to be continually updated to realign them with the reality of where the project is at any given time. Although it is important to use these traditional cost and schedule management tools to control the job, the supervisor should realize that there are a number of problems associated with their use. First, traditional controls focus at the project level, not at the point of execution of the work, the point that we have referred to as the workface. Schedules are generally developed and maintained by project managers, and then information is spun off to the project with more limited scope and greater focus as schedules work their way down through the trade contractors to the crews executing the work. Cost control systems are also developed at the project level, with information directed down to the crew on a limited basis, and most often only when the cost control system indicates that budgets are not being met. These strategic management tools are valuable, providing a high-level view of activities as they relate to other elements of the project on and off the job site. This view is important since schedules and budgets are affected by many factors remote from the workface, as well as factors where the work is being performed. However, strategic tools lose their power as attempts are made to use them in the field to provide tactical direction at the activity level. |
||
| MANAGING PRODUCTION 293 | ||||
|
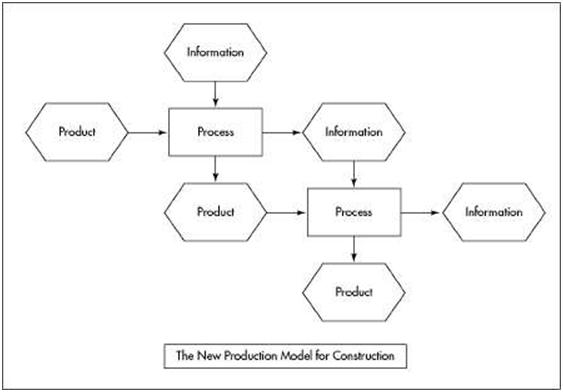
A second problem is in timing. Schedule and cost control systems use information gathered at the site, which is then fed back to a central system for periodic updates of project status. Conditions on the site are continually changing, yet schedule and cost reports reflect conditions from days or even weeks in the past and, hence, are often irrelevant or, even worse, may be inaccurate compared to the current status. A third problem is that traditional reports show symptoms, not problems. They indicate when projects, or major parts of a project, are behind schedule or over budget, but they give no information regarding why. These reports are of little help in developing effective solutions for the problems that cause the symptoms. Moreover, the solutions that are posed will often produce side effects, which, in turn, must be addressed when identified. Hence, traditional approaches to project control, though important and somewhat useful at the overall project level, are often inadequate for tactical control at the activity level. A new set of tools is required that will enable better understanding of the current status of the job at any time and that will highlight problems, rather than symptoms so that effective solutions can be developed and implemented on a timely basis. The goal of this new approach is to improve project outcomes, not just activity outcomes and, thereby, to improve company performance overall. A Production Model for Construction A new production theory for construction will be developed based upon a simple model that can provide an understanding of how construction works. This model will lead to more effective tools to control the construction process. This new model is based on activities and relationships between these activities. This concept should be familiar to the supervisor, from the discussion of network scheduling in Chapter 14. Here, activities were defined, and you learned that project schedules are built based on activities and their durations (time), and the relationships between activities. In the new model, activities are linked by a physical product or information and also by shared resources (see Figure 15.9). |
||||
| Example | ||||
|
To illustrate the new production model, a sequence of activities required to construct a partition in an office building will be used. The sequence begins with an existing product—the floor on which the partition will be framed. Information is required, such as partition layout, the materials required to go into the partition, and the location of openings. Physical resources are acquired, such as studs and channels for framing. Other resources are also used, such as time, space, and labor. Once these resources have been assembled, a process is executed to install the studs and channels, resulting in a new product—the framed partition. This sets up a new cycle to provide electrical rough-in for the partition. The electrician needs new information, including what electrical units go into this partition, such as |
||||
| 294 TECHNICAL SKILLS | ||
|
switches and outlets, and where they are located. The electrician takes new resources, such as conduit and boxes, and executes a new process resulting in a new product—the roughed-in framed partition. Finally, the drywaller comes in to hang gypsum drywall on the framed, roughed-in partition. New information is needed, including where the electrical boxes are, where the openings are, and what type of gypsum drywall and fasteners are specified. After the drywaller executes the new process, a new product is created—the drywalled partition. |
||
|
The new model shows a system of linked activities. These activities are often tightly linked, which means that one must be completed before the next can start, or that resources from one process must be released before they can be used in the next process. The drywall cannot be installed before the electrical rough-in is completed. Examples of shared resources are space and time: electricians and drywallers cannot work in the same space at the same time. This model also has another noteworthy characteristic. It contains a great deal of variability. The model is time-based, so durations for each activity must be developed. The estimate of activity durations will attempt to capture the most likely time in which the activity will be completed. However, in reality, an experienced supervisor knows that sometimes everything goes right and the activity can be done in a shorter time. There is also a likelihood that problems will occur and the duration will be exceeded. Occasionally exceptional performance is encountered in the |
||
 |
||
| Figure 15.9 The New Construction Model | ||
| MANAGING PRODUCTION 295 | |||
| Likelihood |  |
||
| 1 2 3 4 5 6 7 8 9 10 Duration |
|||
| Figure 15.10 Variability of Activity Duration execution of an activity and the actual duration is significantly less than estimated. On the other hand, sometimes multiple problems occur, and the duration is significantly extended beyond that which was estimated. Exacerbating this variability is the influence of the tight linkage of activities, so that not only is activity duration variable but also when activities occur is variable. This variability is illustrated in Figure 15.10. A statistician would immediately recognize this type of variability as being statistical. Hence, our model of construction is characterized as a system of tightly linked activities subjected to statistical variation. Consider now what happens when this model becomes operational. The model will be represented by a game or simulation that involves moving objects through a series of stations and off the table of play. The movement is controlled by the roll of an ordinary die, of the kind which might be used in a number of dice games. Production Model Simulation The simulation is set up by placing a team of five players around a table. The team is given a die and a store of 100 objects. The objective of the game is to move all 100 objects around the table and off the board. As play begins, the first player rolls the die, takes that number of objects from the store and makes those objects available player two. These objects become the inventory of player two. Player two rolls the die and takes from his inventory the number of objects shown on the die, making them available to player three. If there are not enough objects in player two’s inventory, all |
|||
| 296 TECHNICAL SKILLS | ||
|
those available are moved and player two’s inventory goes to zero. The play moves successively around the table until the last player moves the objects off the table. Play then moves to the first player to begin the next cycle of play. When all objects have pulled through a players position, he drops out of the game so that successive play skips him. The game is completed when the last player takes the last objects off the table. In analyzing the play, it soon becomes apparent that only the first player can move all possible objects each time the die is rolled because he has the initial store of objects. Successive players are constrained by the number of objects in their inventory, and sometimes this is less than the die would allow them to move. To put this in terms of production, the player is resource constrained. The roll of the die represents production capacity and the number of objects moved represents production performance. Performance and capacity are always matched if there are no resource constraints, the situation represented by the first player. However, all other players, from time to time, will experience resource constraints, so they will waste capacity by not being able to move as many objects as the die allows. Further analysis reveals that the second player is affected only by negative performance of the first player, but the third player is affected by negative performance of either the first or the second player. This cumulative impact is the result of the tight linkage between the players, and it increases as the number of players increases. Two lessons about production in construction are learned from this model. First, the construction process is made up of a sequence of tightly linked activities so that each activity is directly affected by the previous activity and indirectly affected by a long chain of prior activities, perhaps extending all the way back to the beginning of the job. Second, when planned work is disrupted by an earlier activity, performance suffers because capacity, based on the plan, cannot be fully used and is, therefore, wasted. Statistical variation is introduced into the model by the roll of the die. It represents the variability in estimated project activity durations, which is a key part of the planning process. If, in the simulation, we want to improve performance, one way to accomplish this is by eliminating the variability. To take this to the extreme, if the same number is placed on each of the six faces of the die, performance is balanced throughout the game. Each time the die is rolled, the exact same number of objects will be passed from player to player. Waste is eliminated. Performance is totally predictable. The game will be finished more quickly because there is no loss in performance at any point. Of course, putting the same number on each face of the die makes the game trivial. However, eliminating this variability on a construction project would be highly desirable. Applying what we have learned to the construction process, we can see that eliminating the statistical variation in the model represents eliminating the variability in the planning process in construction. If planning is reliable, negative impacts on successive activities are eliminated. Waste is eliminated and completion is achieved sooner. The key is to improve the reliability of planning in the construction process. This dice game simulation was initially set forth by Eli Goldratt in his classic book on production, The Goal (North River Press, 1985). The dice game simulation |
||
| MANAGING PRODUCTION 297 | ||
|
was extensively studied by Iris Tommelein and is summarized in her paper titled “Parade Game: Impact of Work Flow Variability on Succeeding Trade Performance” (Proceedings Sixth Annual Conference of the International Group for Lean Construction, IGLC-6, 13-15 August 1998, held in Guaruja, Brazil). Construction Process Design The planning process is where production is designed in construction. In manufacturing, the production process is dictated by the design of the manufacturing tools and the layout of those tools on the manufacturing floor. As a product is manufactured, it moves from tool to tool, each tool executing a process to move the product toward completion. In construction, the successive manufacturing processes are moved through the product in a sequence of activities similar to those previously discussed in the example of building the partition. Construction process design focuses on planning of individual activities and then assembling these activities into an efficient sequence. The construction planner is a construction process designer. Just as in manufacturing, where the quality of the design of the tools and manufacturing floor have a strong influence on production efficiency, in construction, the reliability of the construction process planning plays a major role in determining whether the project will be completed on time and within the budget. Planning in construction is now, and has been in the past, notoriously unreliable. The Lean Construction Institute has carried out many studies over the years on a variety of projects, which have indicated that planning reliability on successful jobs generally hovers a bit over 50 percent. That is, on an average successful job, construction plans are reliable about half the time. Yet, from the simulation, we concluded that planning reliability has a great impact on project success. Clearly, it is important then, for the supervisor to consider how to improve reliability in construction planning. Improving Reliability in Construction Planning The Last Planner Process©, developed by the Lean Construction Institute, has been used to improve reliability in construction planning. In construction, many plans are developed, expanded, and revised throughout the duration of the project, but the only plan that is implemented is the one the foreman makes when work is assigned to the crew. Thus, the foreman is the last planner in the succession of construction planners, and the foreman’s plan is the one that has significant impact on the execution of the work. The plan that the foreman uses is typically formulated through the weekly planning process on most commercial construction jobs. At a weekly coordination meeting, supervisors from the various trades meet to discuss what will be accomplished during the next week, resulting in a short interval schedule for the week. The intent is that those responsible for the numerous tightly linked activities in process on the job site can coordinate with one another to sequence their activities and develop plans that will allow them to bring together |
||
| 298 TECHNICAL SKILLS | ||
|
the resources to move the work forward efficiently. Commitments are made at these meetings, and based upon commitments, plans are developed. The typical driver for planning is the project network schedule that shows critical and subcritical activities that must be accomplished during the ensuing week so that the project will not be delayed. Trade supervisors are expected to commit to working on the critical activities, since, if these activities are delayed, the project will be delayed. On a schedule-driven project, other considerations required to complete the activity, such as adequate labor, resources, and equipment, become secondary. The critical path network scheduling method leads managers to conclude that work must be performed as a first priority, on those activities that are on the critical path. Unfortunately, since the other considerations noted above do most certainly have an impact on completing activities, at the next coordination meeting, it is revealed that many of the planned activities are not completed. Based on the fact that planning is, on average, about 50% reliable, if each task is reviewed to determine whether it was completed or not, the result would be that about half the activities were not completed. The conclusion is that it is important to consider all of the factors that will affect activity completion, not just whether the activity is on the critical path, when developing the weekly production plan. The Last Planner Process© suggests considering four criteria before making the commitment to place an activity on the short interval plan. The four criteria are: ■ Definition ■ Soundness ■ Sequence ■ Size Definition says that the work is well enough described that it can be assigned and the completion of the activity will be well defined. For example, when reviewing planning success at the end of the period, if the sheet metal contractor had listed an activity to complete installation of ductwork in 10 specific rooms, but only 9 rooms were completed, or if 10 rooms were completed but they were not the 10 specified, that activity would have not been completed successfully. Soundness means that all resources required to complete the activity will be available when execution of the activity takes place. This includes physical resources, such as materials and tools, as well as nonphysical resources, like information, and space. Sequence focuses on the physical requirement to complete certain tasks prior to other tasks. In the event that several activities could take place at the same time, proper sequencing means that the choice among those activities available is the best one to move the project toward achieving its goals. Size means that the correct amount of work is assigned so that the crew can complete it with a standard level of effort. Too much work assigned will stress the crew and begin to impact safety and quality, as well as raising the risk that all the |
||
| MANAGING PRODUCTION 299 | ||
|
work will not be completed. Too little work assigned will lead to inefficiency, delaying the project and negatively impacting the budget. The Last Planner Process© begins by developing a list of activities that can be accomplished. They are well defined and sound. Activities that do not meet these two criteria are placed on a make-ready list so that focus can be placed on securing the required resources or redefining the activity until it is does meet these two criteria. Next, sequence is considered when the activities are evaluated with regard to the project schedule and sequenced in order to ensure that critical activities will be completed first, then subcritical activities. Finally, based on labor resources available, work that is appropriately sized is assigned to the crew. At the end of the planning period, each activity should be reviewed to determine whether the planning was successful or not. This is a clear-cut process. Either the activity was completed 100% or it was not completed; 90% completion is a planning failure. One additional step is to follow up on unsuccessful activities in order to determine the cause of the failure. This adds a learning and accountability component to the process. It reveals where chronic failures lie, which allows steps to be taken to eliminate the problem. It also indicates who is responsible for the problems, so that those causing chronic problems can be held accountable for their disturbance to the project. Great diplomacy must be exercised in dealing with those responsible for the chronic problems, because they are often at higher levels in the project, and could even include the designer or owner of the project. The accountability aspect is not intended to assign blame, but rather is intended to identify and eliminate problems so that they do not impact later activities. |
||
| SUMMARY In this chapter, the following key points have been presented. ■ Production is the process of producing a product, whereas productivity is a measure of the efficiency of production. ■ Rates of production can use either money or time as a basis of measurement, but a time basis is more stable than a money basis. ■ A number of tools are available to analyze production, including: ■ The process chart ■ The crew balance chart ■ The flow chart ■ To improve production, first eliminate worker slack time, then relax tight linkage between activities. ■ A First Run Study is used to plan more efficient execution of an activity prior to starting that activity. |
||
| 300 TECHNICAL SKILLS ■ An improved production model for construction is based on a sequence of tightly linked activities subject to statistical variation. ■ Production can be improved by containing the variability in planning and wise use of buffers. |
||
| Learning Activities 1. Production study of an ongoing operation Identify an operation to study on an ongoing project. This could be an operation on a project on which you are working, or it could be an operation that can be studied by observing it from off the site. Some guidelines to use in selecting the operation to study include: ■ The operation should involve a small number of workers. ■ The operation should have a relatively short cycle time. A well-running operation is easier to study and improve than a poorly running operation. Develop a report on your study, including such features as: ■ A brief description of the operation ■ Flow, process, and crew balance charts ■ Photographs of the operation ■ Suggestions for improvements 2. Implementation plan for the Last Planner Process© Consider an ongoing real or imaginary construction project. Develop a plan to implement the Last Planner Process© on the project. A key part of the plan will be to address how various participants will be brought into the process. In particular, what will persuade the various supervisors on the project to participate in the process? What will persuade the designer to participate? What will persuade the owner to participate? Develop a report describing the project and the plan. |
||